Comparing the graphs
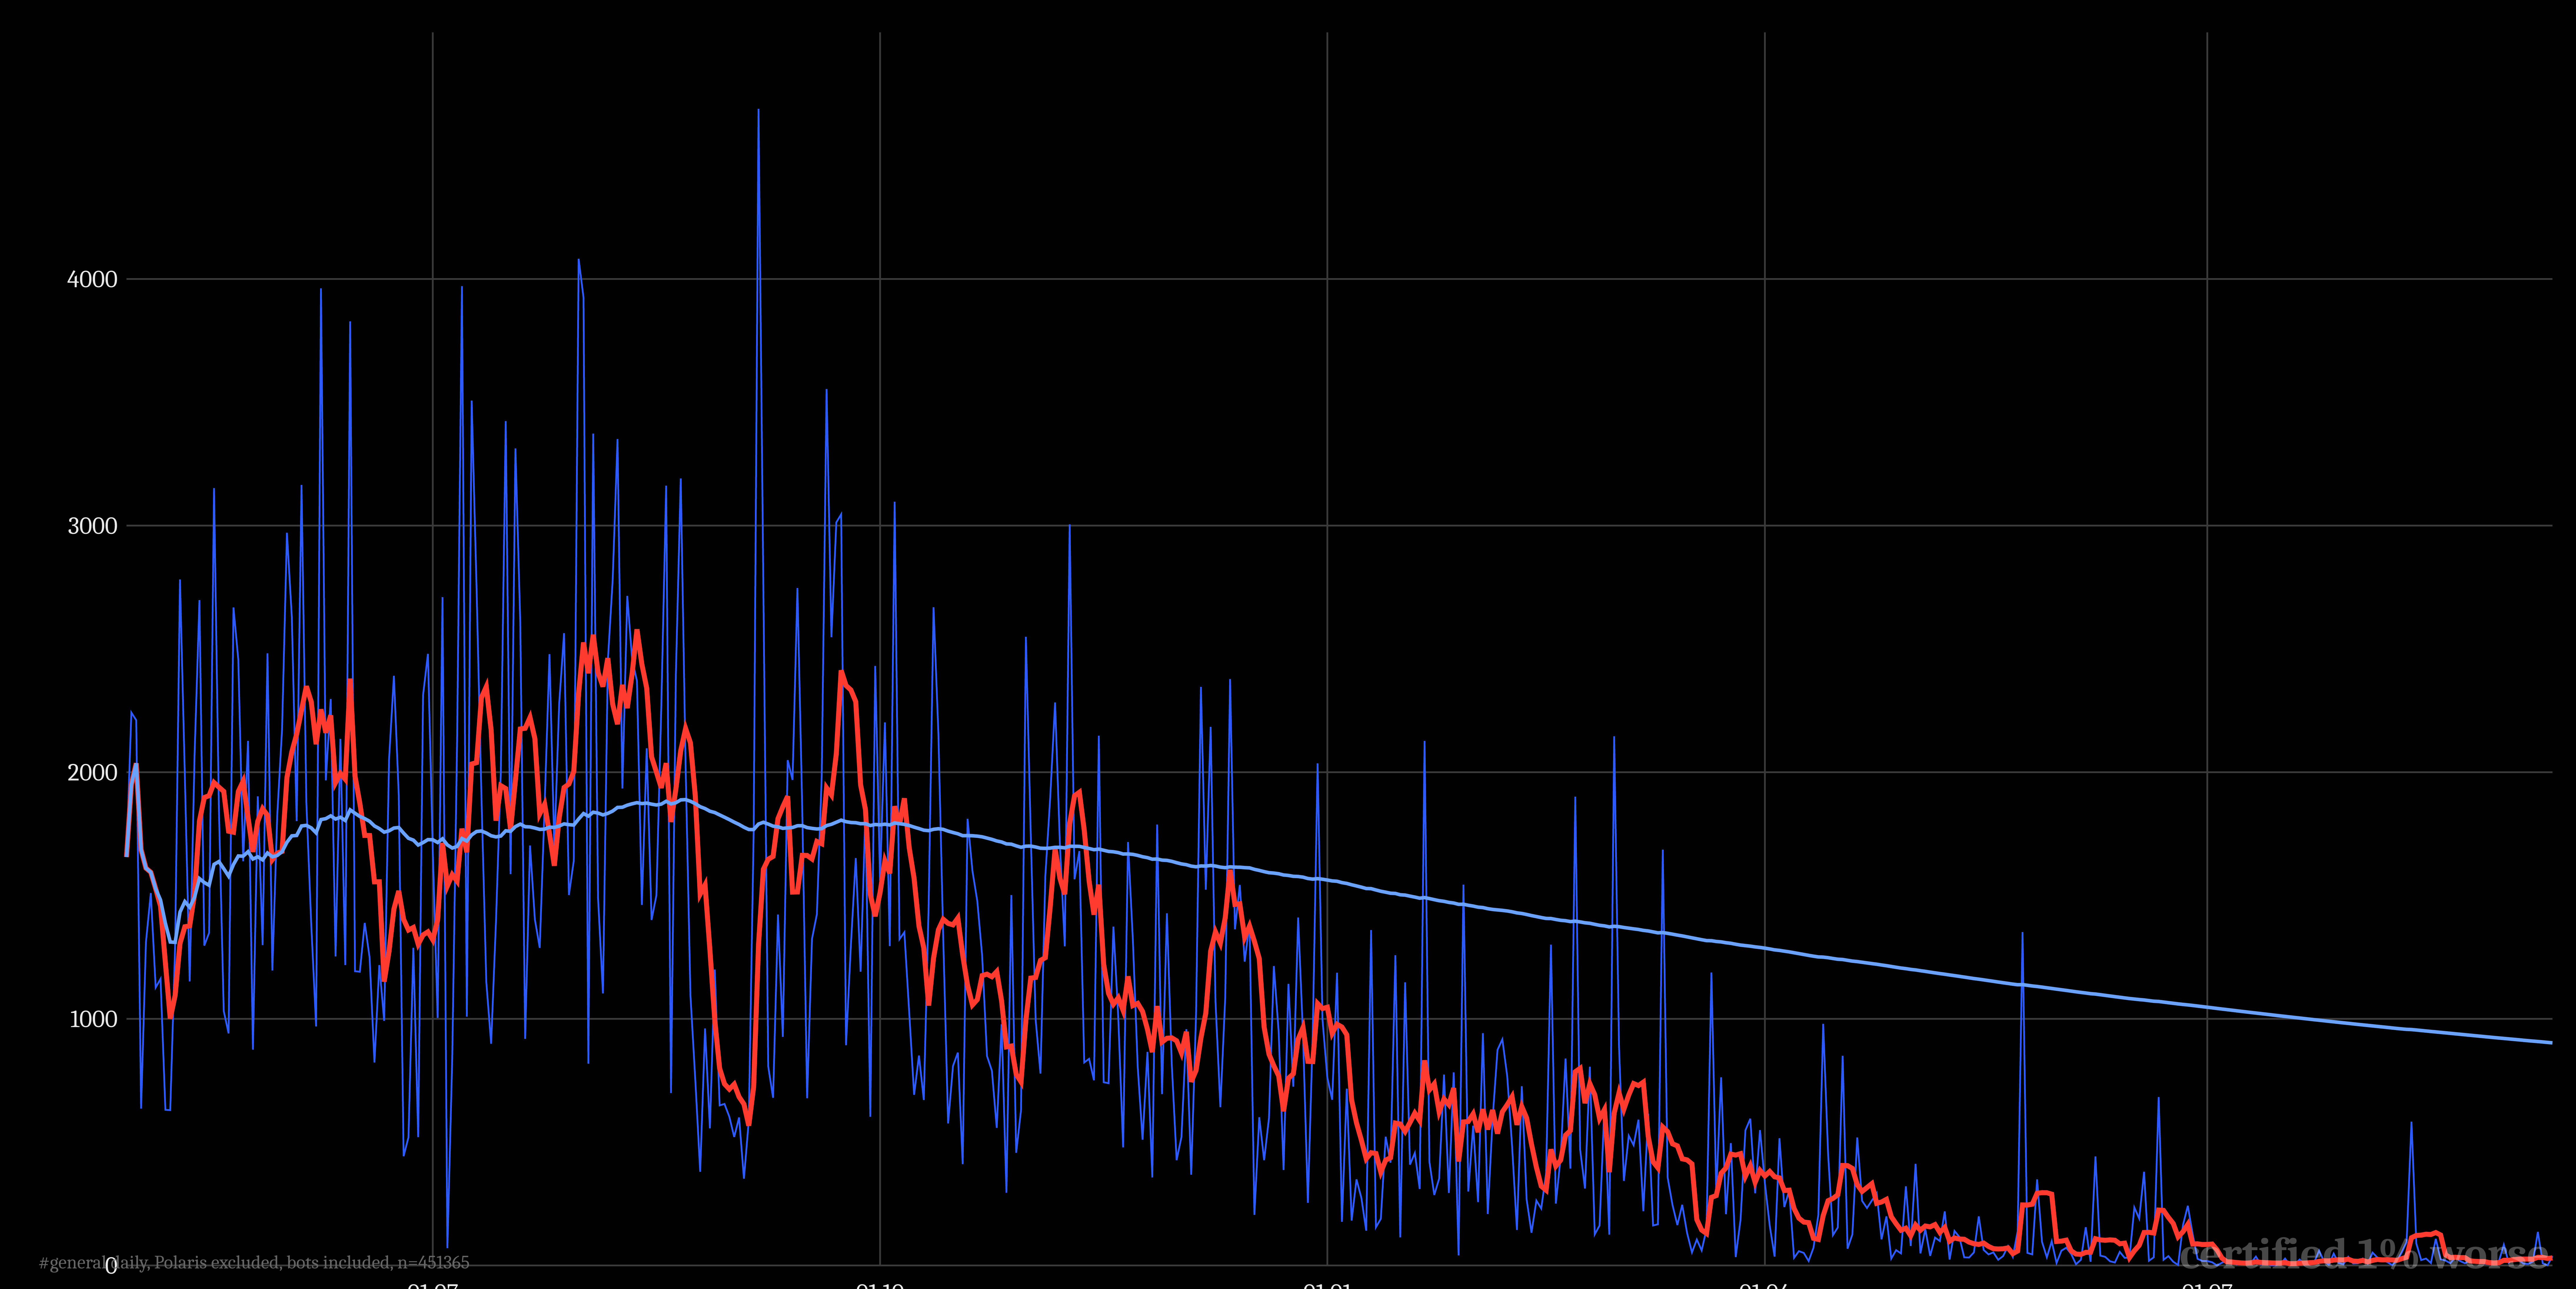
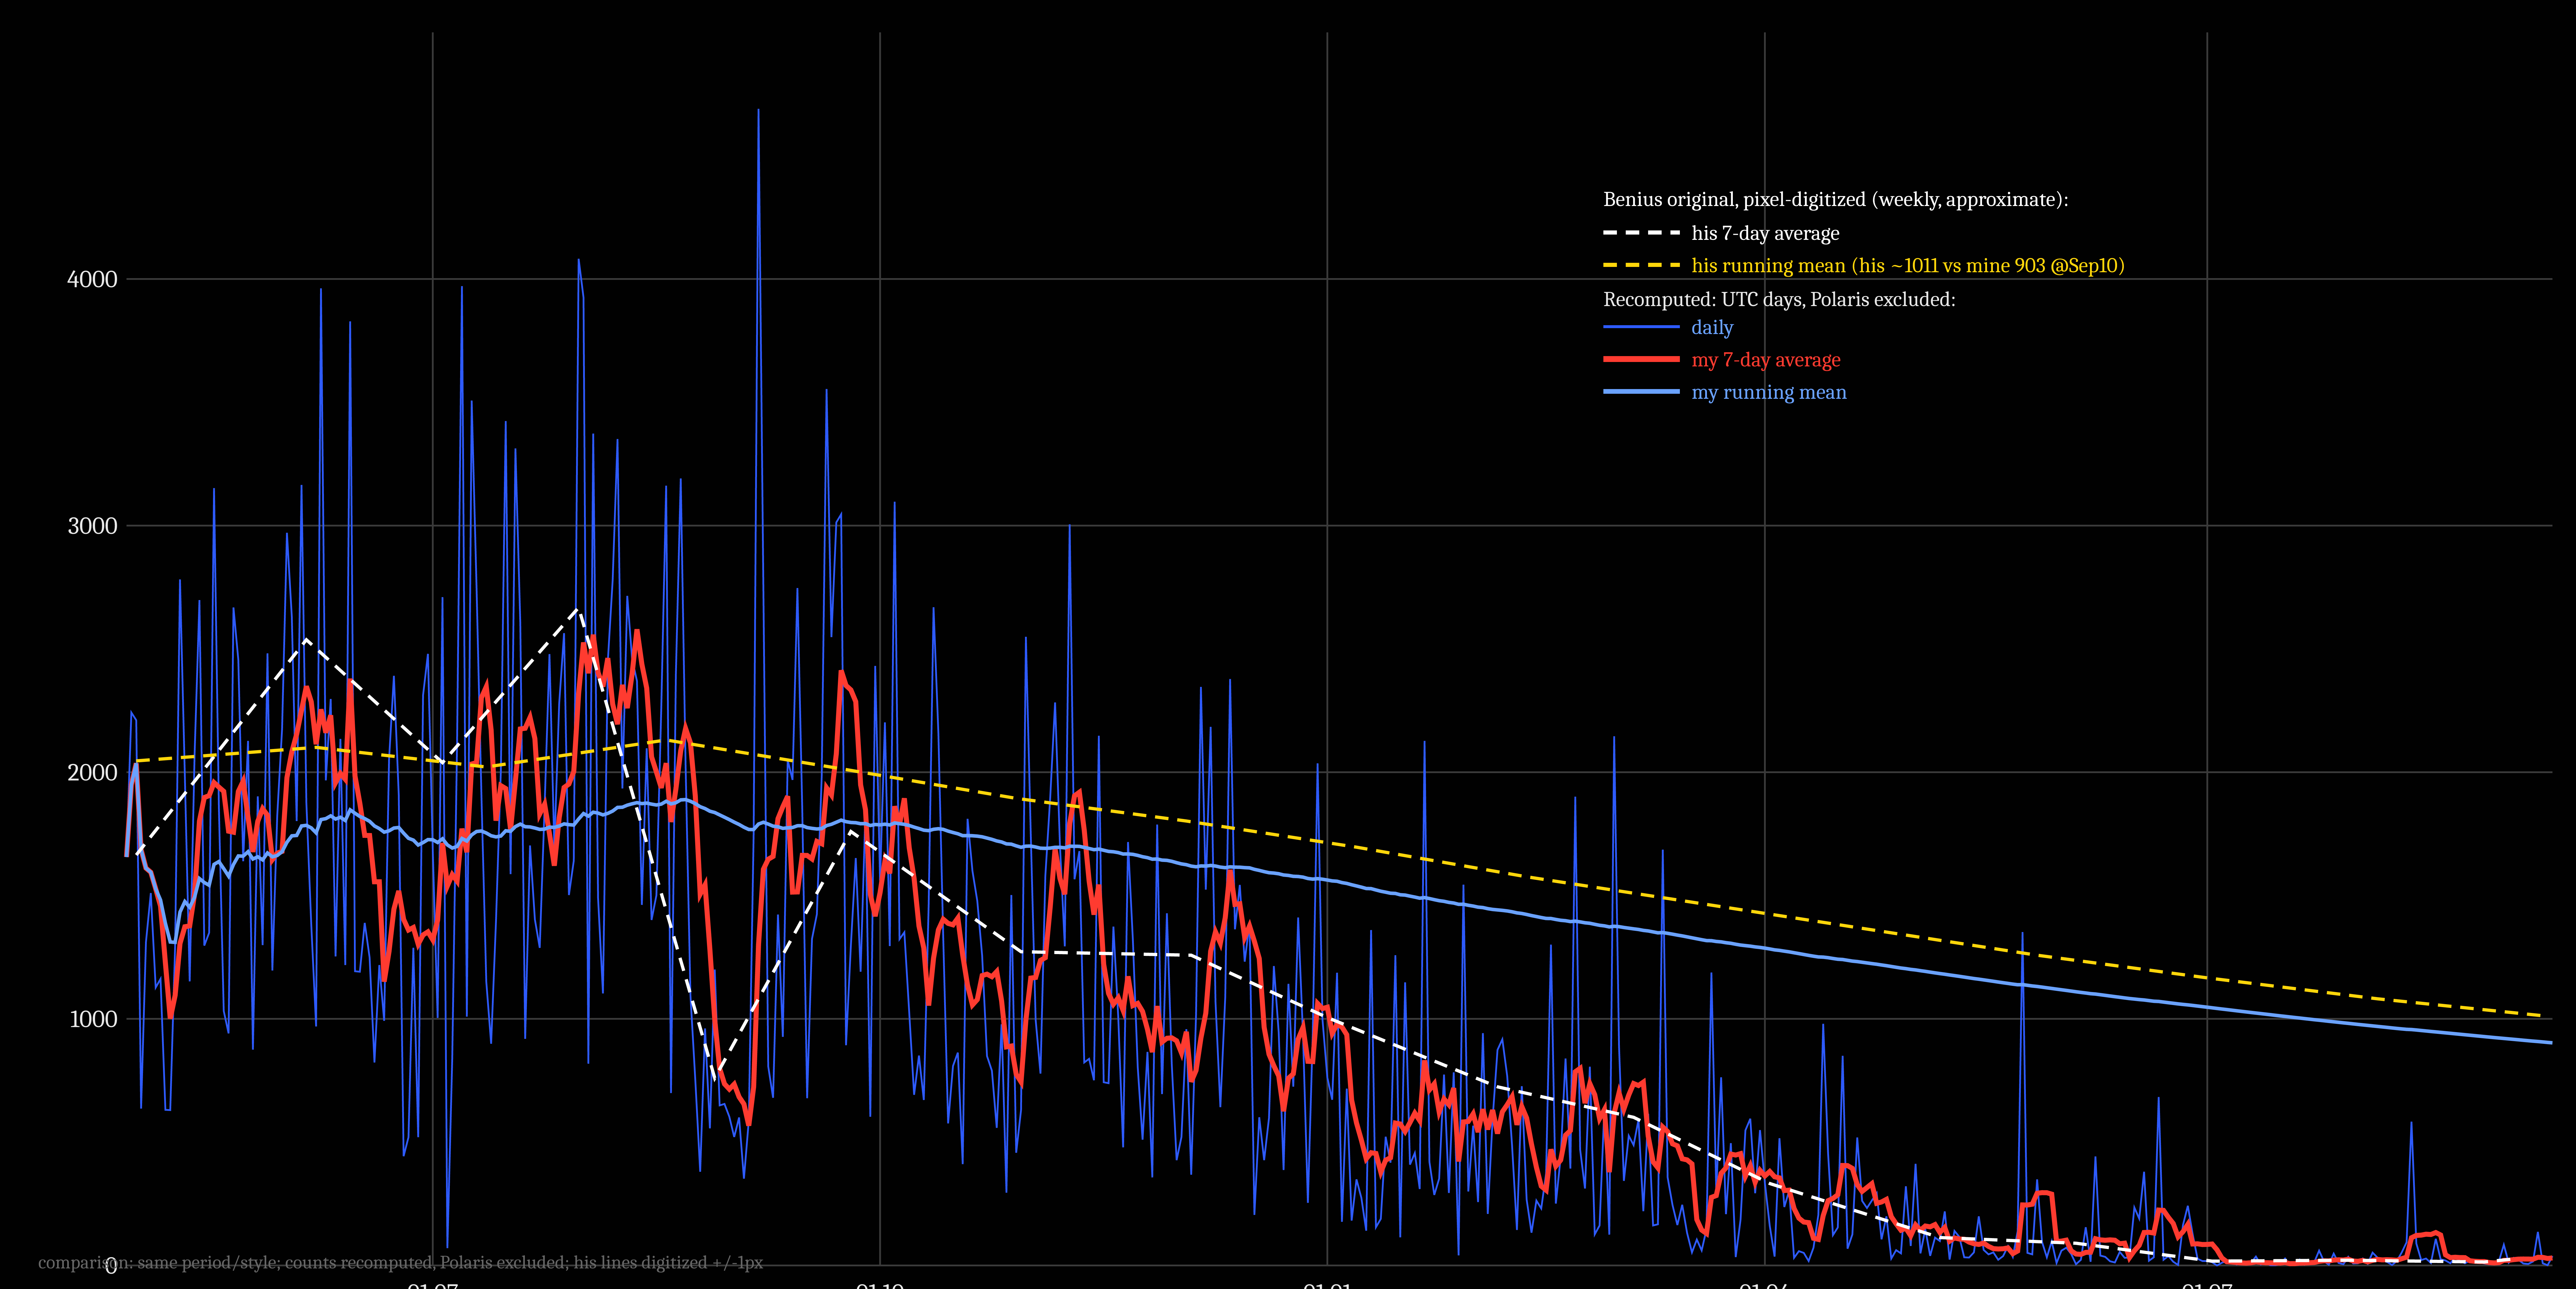
Same formulas where his legend confirms them (daily + 7-day average + running mean), recomputed from the archive. White/yellow dashed = his pixel-digitized lines on the same axes, approximate to about a pixel.
What the comparison shows
- Beniu correctly noticed lower curves. Our series uses UTC days with Polaris rows excluded by standing rule; his filters and timezone are unconfirmed, and his endpoint dates differ (his Oct 10 vs our Sep 10). No causal claim about the historical gap beyond that stated scope difference.
- Timezone note: his Sep-18 figure (957) sits nearer CEST-day rows (958) than UTC-day rows (969), and his Oct-1 tooltip matches CEST rows exactly (2177). CEST is inferred as compatible with these two anchors, not confirmed; he never stated his boundaries.
- Pixel ratios are approximate only: his-vs-my 7-day average per-day median 1.085, IQR 1.03-1.15 (n=432); running mean median 1.120, IQR 1.116-1.130 (n=492). Outliers (5pc MA, 2pc trend) sit at spike-adjacent days and the series start.
- Trend positions: same date Sep 10, his ~1011 vs mine 903 (+108). His 974 endpoint is Oct 10 and carries the Oct-1 lift.
- Oct-1 checks, with timezone/filter caveat: 2177 matches CEST-day all-rows count exactly (his exact filters unconfirmed); first daily-above-running-mean since May 24 itself; Mar-11 max 1942 rows, so over-2000-first-since-Mar-1 holds under the same caveat.
Our series: UTC days, Polaris excluded, bots included. Original: filters and timezone unconfirmed. Coverage: archive-present messages only; pre-archiving deletions unrecoverable, volume unknown. Non-bot-account means authorBot flag false and can include webhook/system proxies.
1pc-worse remake | daily counts CSV